
Income inequality worsens across U.S.
But Illinois beats national averages for income, poverty, health care, with some surprising local findings
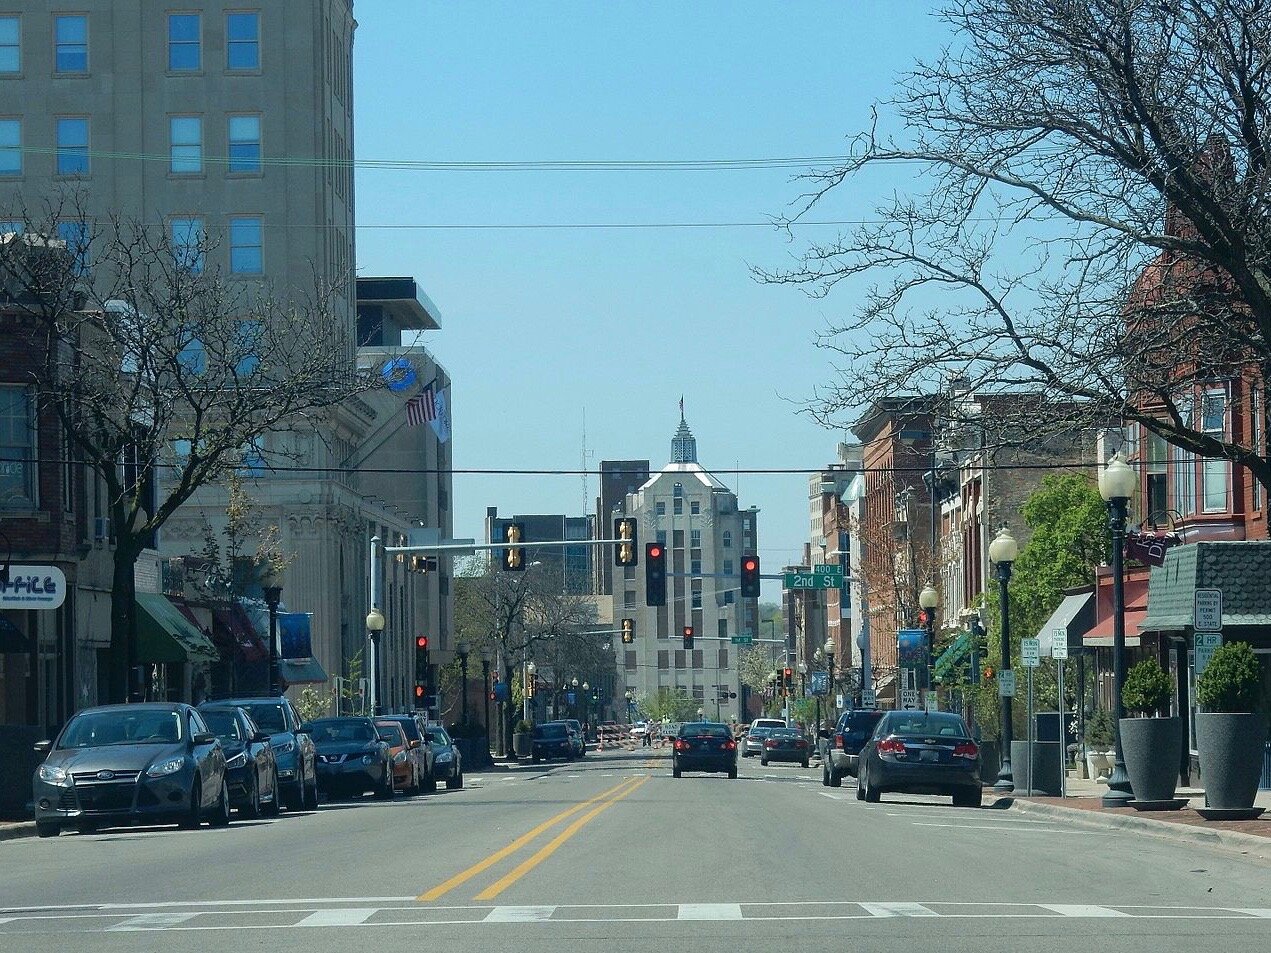
Rockford, seen here looking downtown from East State Street, had the highest rate of residents with broadband, at 87.5 percent. (Wikimedia Commons/Alex Baumgarner)
By Ted Cox
Income inequality is worsening across the United States, but Illinois is holding its own against the national average on income, poverty, and health insurance, according to the latest U.S. Census data released Thursday.
Calling it the “most detailed look at America’s people,” the U.S. Census Bureau released its annual American Community Survey data for the 2018 calendar year. It found the median income in Illinois — the midpoint for those earning more or less — to be $65,000, above the national average of $62,000. Some 12.1 percent of the state population was living below the poverty level, under the national average of 13.1 percent. And 7 percent of Illinoisans were without health insurance, well below the national average of 8.9 percent.
Nationally, there was good economic news as the median income rose from $60,000 in 2017 to $62,000 last year, the average home value appreciated from $218,000 to $230,000, and the percentage of those living below the poverty line dropped from 13.4 percent to 13.1 percent.
But the Census Bureau also reported that a key measure of income inequality rose to the highest level ever recorded in the United States. The Gini index measures income inequality on a scale from 0 to 1, with 0 being a totally equitable society where everyone has the same and 1 being a society where all wealth is concentrated in one household. The U.S. Gini index rose “significantly higher” from 0.482 in 2017 to 0.485 last year, according to a U.S. Census Bureau news release. When the bureau began compiling the Gini index in 1967 it stood at 0.397. Last year, no European nation had an index higher than 0.38.
The bureau didn’t give a state-by-state breakdown on the Gini index, but reported that most states, including Illinois, saw little or no increase last year. It worsened in Alabama, Arkansas, California, Kansas, Nebraska, New Hampshire, New Mexico, Texas, and Virginia. Overall, income inequality tended to be worst on the coasts, including California, Connecticut, Florida, Louisiana, New York, the District of Columbia, and in Puerto Rico.
“Each completed survey is important because it is a building block used to create statistics about communities in America,” said Census Bureau American Community Survey Office Chief Donna Daily. "This information provides an important tool for communities to make data-driven decisions, assess the past, and plan for the future."
“This information provides an important tool for communities to make data-driven decisions, assess the past, and plan for the future.”
But, again, Illinois thrived against the national average, and a spin around the state’s top metropolitan areas on the 2018 ACS Data Wheel turned up some interesting results.
Chicago, of course, was the largest metropolitan area, especially as the census bureau’s boundary includes Elgin and Naperville. It had 9.5 million people, the highest media home value, at $248,000, the highest median salary, at $71,000, and the lowest rate of those living below the poverty line, at 11.2 percent. It also easily had the highest percentage of residents born outside the United States, at 17.7 percent. But it also had the highest rate of those without health insurance, at 7.6 percent, an indication perhaps of the strength of the Cook County health-care system, but also the pressure it’s under.
Cook County just joined in a suit filed against the Trump administration charging that imposition of the so-called public-charge rule, weighted against granting citizenship to aspiring immigrants who use public aid like Medicaid, food stamps, and housing assistance, would discourage immigrants from enrolling in Medicaid and instead thrust them into the county system for health care.
The Carbondale-Marion area had the lowest median income, $43,000. Danville, the smallest area by population at 77,000, had the lowest median home value, at $85,000, and was the only metro area to come in under $100,000 in that category. It also had the highest rate of those living below the poverty line, at 19.8 percent, and the lowest with broadband access, at 76 percent, well below the national average of 85.1 percent.
Champaign-Urbana had the lowest average age, at 31.7 years old, a reflection perhaps of how the University of Illinois flagship campus dominates the area. Springfield had the oldest population, at an average of 41 years old, but also the lowest rate of residents without health care, at just 3.5 percent.
Rockford had the highest rate of residents with broadband access, at 87.5 percent.
Decatur had the lowest rate of foreign-born residents, at just 2.2 percent, and was right behind Springfield in average age at 40.9. Kankakee had the lowest rate of high-school grads, at 87.5 percent. Bloomington-Normal had the highest rate of grads at 96 percent.
This quick spin around the state data did not include the St. Louis and Cape Girardeau, Mo., areas, as both are heavy with Missouri residents, but did include the Quad Cities, more evenly split between Moline and Rock Island on the Illinois side of the Mississippi River and Davenport and Bettendorf on the Iowa side. That region might be the most normal in the state, however, as it didn’t lead or trail in any of the data categories.